An Analysis: Swipe Left on BTO-at-35

These observations and views are purely personal experiences and opinions, so do take them lightly. 🌝
Preamble
Amidst a whirlwind of wedding invitations and constant discussions about BTO, there is me - the singleton in a symphony of couples. Before my parents start arranging blind dates and marriages, I have decided to venture into the world of digital dating, immersing myself in a dance of swipes, profiles, and digital dialogues.
As I embark on my journey as a data scientist, a whimsical thought struck me - why not delve into the depths of my own real-life encounters and subject them to analysis?
And what dataset could be more interesting than my own dating app experience? So for the month of July 2023, I began tracking the statistics of my experience with dating apps in Singapore, as a 25-year-old male navigating the realm of these apps as a free user.
Part I: The Game of Swipes
First of all, we should all understand the phenomenon of the dating app scene. I happened to chance upon this fantastic video that explains the situation with such accuracy, using models and assumptions—a language spoken by data scientists and statisticians.
Please give the video a watch before continuing, and I will be summarizing the learning points from this video and my observations from it as well.
Why are men getting fewer matches?
The median number of matches for men is skewed by the imbalance of several factors:
- Significantly more men than women uses dating apps (Gender imbalance)
- Men give more likes than women (Engagement bias)
- A small share of users get a big share of the likes (Engagement imbalance)
What is the result of these?
As men don't get as many likes, they start giving likes more generously to improve their chances of getting matched.
Studies indicate that dating apps can have a negative impact on self-esteem, with a stronger effect on men.
Women are overwhelmed with choices, making them think more carefully about who they give likes to, and since guys are so generous with their likes, there is a good chance he is not even genuinely interested.
Women often have to find strategies to deal with intrusive behavior from men.
What is my strategy?
Given my conviction that I do not inhabit the upper echelon of the top 15%, I have instinctively embraced the approach outlined earlier. Consequently, my strategy revolves around dedicating extra effort towards crafting an impeccable dating profile and adopting a more generous stance when giving out likes.
Part II: Match Statistics
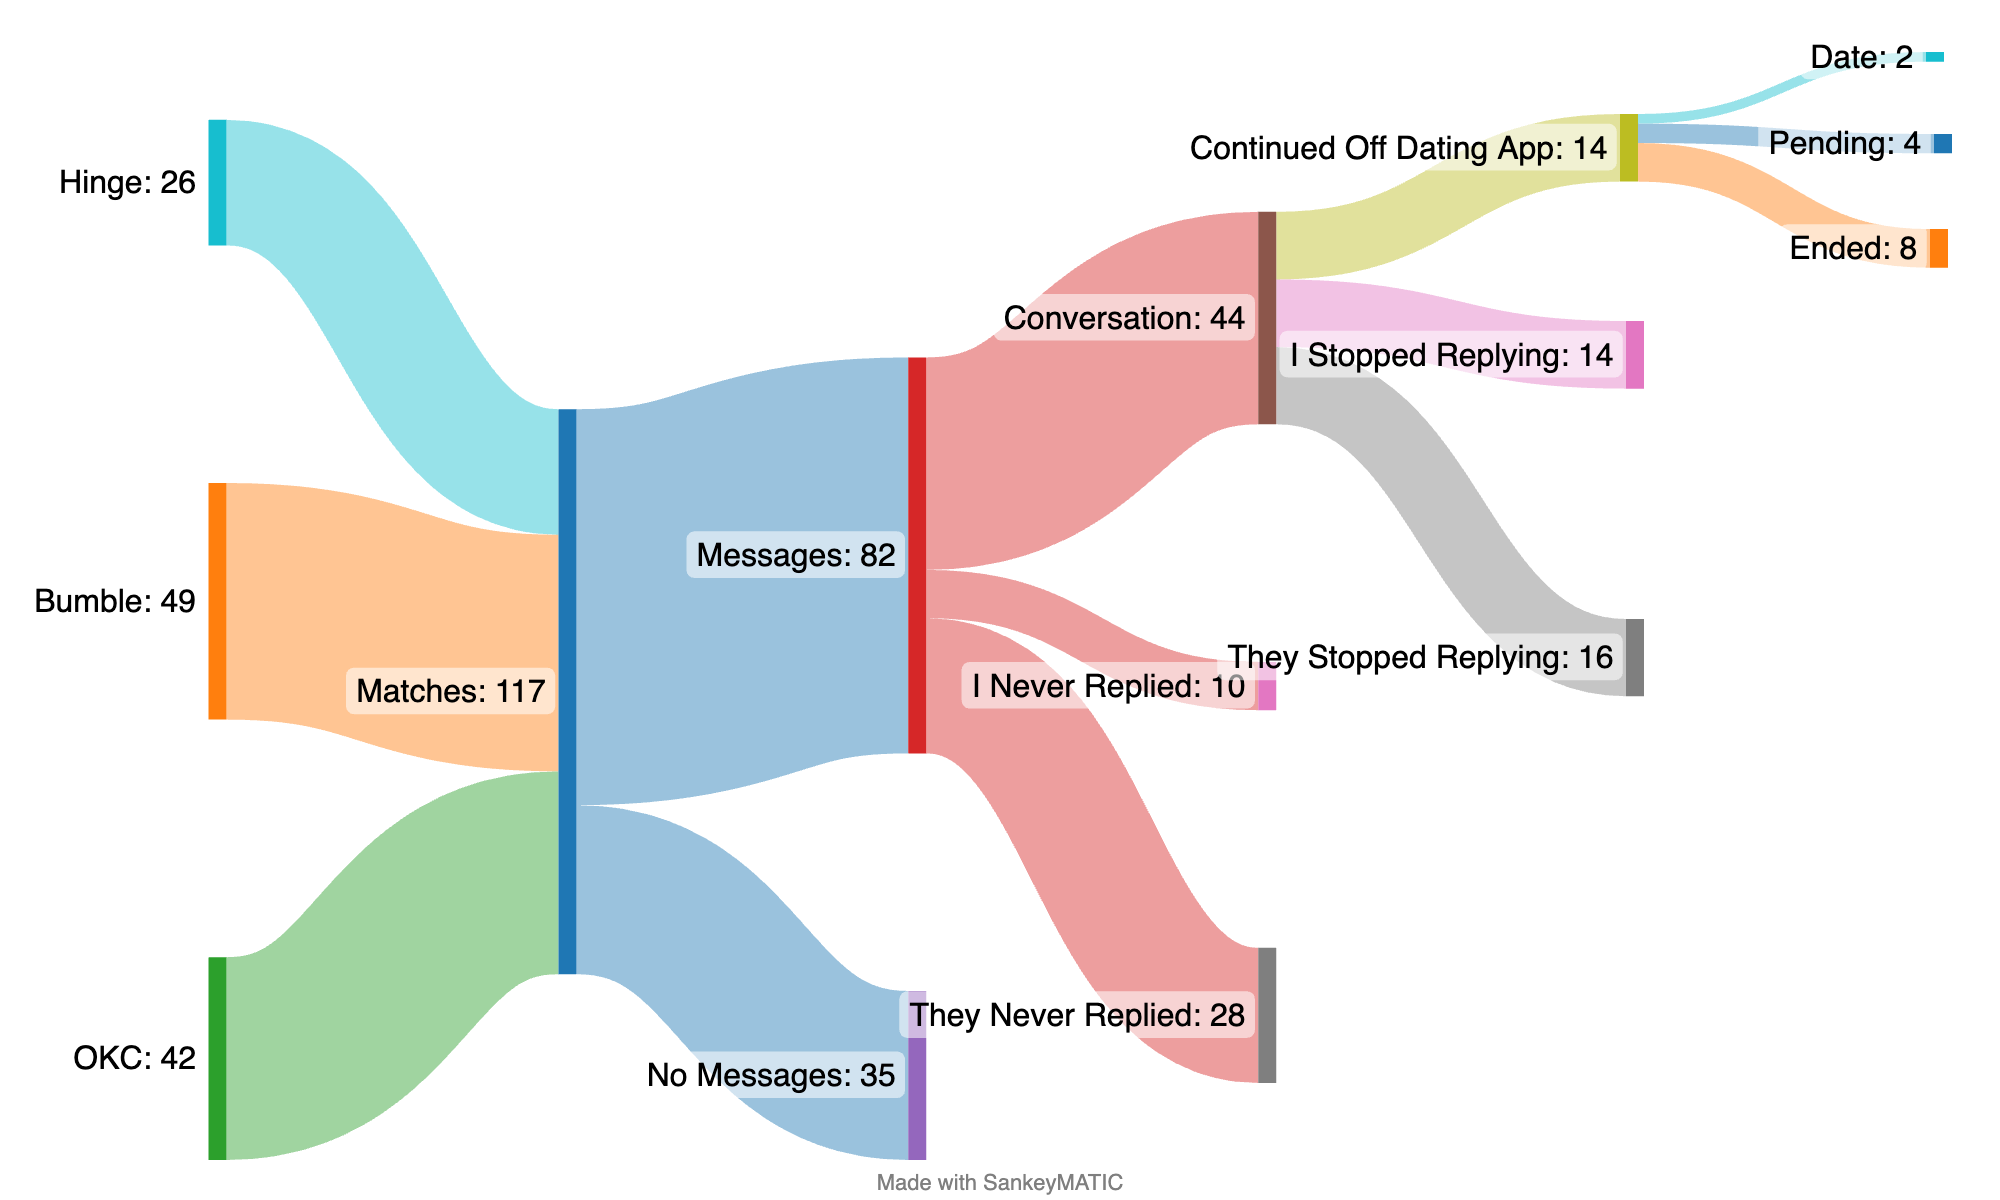
Below is a Sankey Chart of the statistics for the month of July 2023.
Sankey Chart of Dating App Statistics
What could be optimized?
From the observation of the sankey chart:
Firstly, a significant portion, accounting for 30% of the total matches, did not transition into any form of messaging. Given my proactive role in initiating conversations, this observation suggests the possibility of being more discerning and deliberate when doling out likes.
Secondly, among the matches that did progress to messaging, approximately 27% failed to elicit any response. This statistic sheds light on the potential room for improvement in crafting more compelling opening messages to engage and capture the interest of potential matches.
Pie Chart of Dating App Statistics
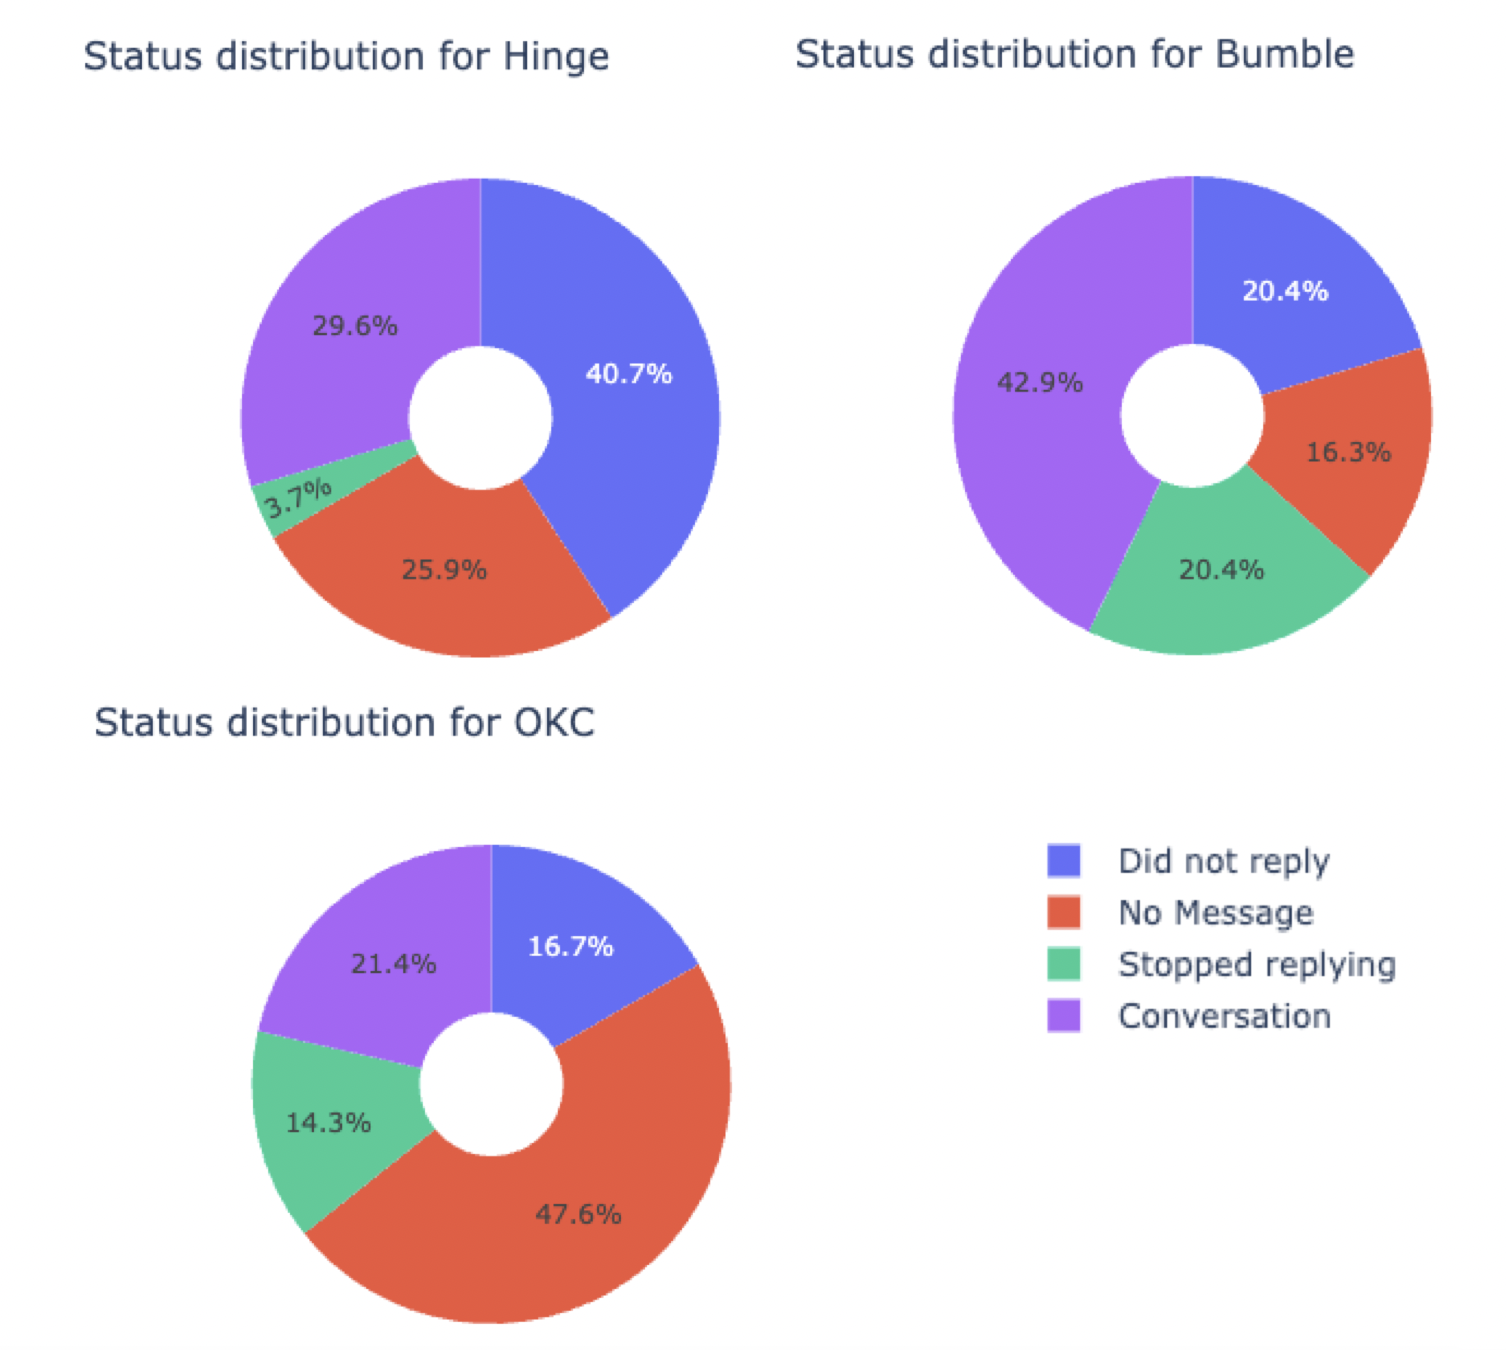
In terms of statistics, OKC has the worst Match-to-Conversation ratio of only 21.4%. This data point places it at the bottom of the list among the three platforms. Interestingly, this numerical finding aligns seamlessly with my personal experience that I had with the platform in terms of user experience and quality of matches.
Bumble boasts the most noteworthy Match-to-Conversation ratio due to its distinct approach - requiring women to initiate the conversation within a 24-hour window, lest the match expires. This time pressure encourages women to initiate conversations more frequently, resulting in its high Match-to-Conversation ratio.
Although most Bumble matches starts off with only a "Hi", tossing the ball back into my court and requiring me to take the lead in driving the conversation.
Limitation
This chart is limited in information from which to draw conclusions and only offers a big-picture view of the statistics. The chart does not tell me about the quality of the matches on each platform, and there could potentially be a data imbalance present in each app, possibly due to the different demographics of the users.
A more detailed approach could be used to include factors such as user feedback, satisfaction ratings, success stories, or user demographics. These additional data points could then provide some insight into the respective dating apps.
Conclusion
In conclusion, keeping track of the data from personal experiences is indeed an interesting way to gain insights into my own preferences, patterns, and experiences. This self-reflection can hopefully lead to enhanced decision-making and, ultimately, an increased likelihood of finding a potential partner.
This is definitely a good experiment to get me more proactive and mindful about the data that surrounds me in the digital landscape as I continue to explore and understand the broader implications of data in my life.